Database design: tips for effectively presenting data

TABLE OF CONTENTS


Databases are essential for businesses to organize the structure, document processes and make it easier to maneuver through all the data information systems. Here is how database design can help increase usability and user-friendliness in and outside your organization.
Let’s start from the basics: what is database design, anyway? As the name suggests, it’s the creation of databases, or storing and presenting data according to a specific database model.
But there’s more to it than meets the eye. If you want to know how to design a database, you need to be clear on two things:
- What information are you using, and how is it organized
- How are you presenting the information
The first will highly depend on the database at hand, as well its intended purpose/audience. Something you want to use internally in your company/organization will likely be a lot more detailed, than a concise version you put out for a wider audience.
On the other hand, learning how to design a database visually is something we can help with. Although this is an often overlooked aspect, database design can greatly improve the user experience, and therefore make your databases an even more valuable resource.
Additionally, good graphics and information design also become a strong competitive advantage. For example, if you share your databases with customers, as is often the case with real estate databases).In this article, we’ll offer five practical uses of graphic design to enhance the look of your database.
{{PRESENTAION_BANNER="/dev/components"}}
5 Ideas to help with designing a database
So you’ve done the work and gathered some useful data. Awesome! Now it’s time to transform it into a visually appealing database that you can use.
Here are some design elements and ideas to guide you.
Infographics and charts
One of the most valuable elements in designing databases are charts and infographics. Given that people's attention spans are shortening by the day, it's understandable that we'd like to make complex material more digestible in this way.
Infographics and charts come in a variety of shapes and sizes, including:
- Statistical: These can be basic graphs and charts, as well as infographics that convey study findings and figures. You may use them in combination with other visual components such as icons to make them more attractive. They usually contain little text.
- Informational: Used to convey several bits of data in a logical order. They're commonly broken up into sections with distinct titles and more text than statistical infographics.
- Timeline: This is a great way to show how anything evolved, whether it's historical events or a project. Design can assist you in highlighting changes over a certain period of time.
- Process: A term used to describe the stages involved in a particular procedure. Because they're chronological, the sequence of items (left to right, top to bottom) is a major design consideration. Design features like arrows also help consumers follow the stages in the correct order.
- Comparison: Perhaps one of the most common forms of infographics. People frequently provide a visual comparison of two (or more) items. This is a fantastic idea for those looking to share data insights with a broader audience (e.g., your customers).
You might know that most marketers agree that infographics are the most effective content marketing asset. But are they as effective in databases?
Absolutely. The main advantage of infographics is significant informational value. They are a way to pack tons of critical data into one digestible format. Excel spreadsheets and extensive reports are suitable for comprehensive data entries and in-depth analyses. Infographics, on the other hand, are the perfect way to present the key takeaways.
They’re also a great way to summarize end-of-the-year results and share them within your organization (or externally).

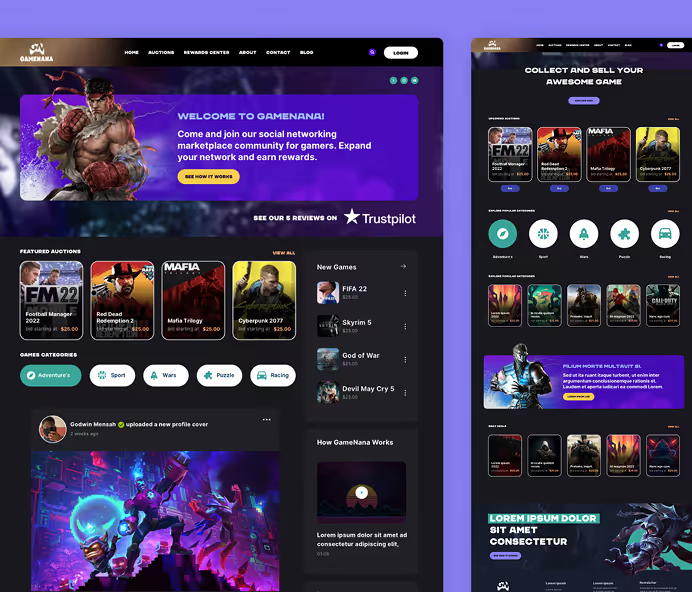
You can find heaps of useful database design examples on Miro Community, such as these visually engaging boards for a training course.
Source: ManyPixels
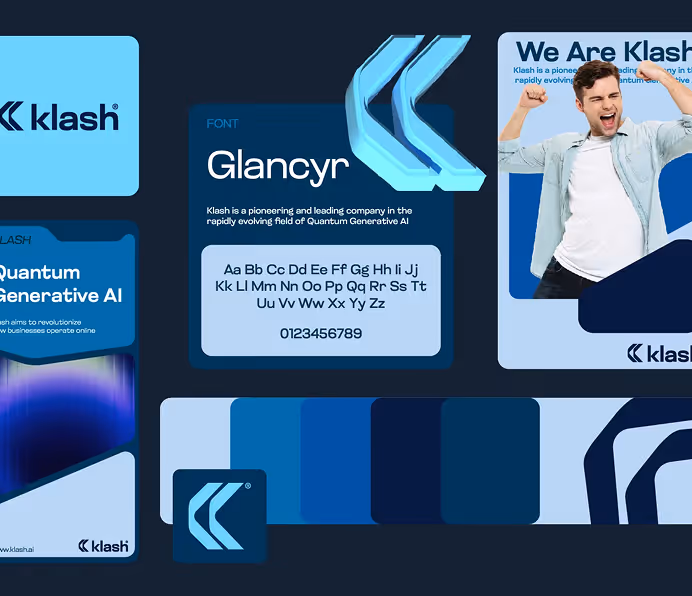
Of course, if you're creating something that will be shared outside or within your organization, you must make sure the visuals follow your brand's color guidelines.
Source: ManyPixels
Infographic design by ManyPixels
Process workflow maps
Process mapping is a visual representation of a workflow that allows a team to better understand a process and its components. Workflow maps are different from a process infographic because the latter doesn’t always present a process. Sometimes, these infographics explain the structure or organization of a project, company, document, etc.
If done well, process workflow maps can be a tremendous time-saving asset. Why waste hours in a training session when you can create a process workflow that allows each new team member to grasp the ins and outs of a particular process quickly.
A process map can also show the specific phases in a process, who is responsible for what, and when. This is especially useful for involving stakeholders in processes and identifying opportunities for improvement. Most process maps begin at a high level and then go into further depth as needed.
The following are a few examples of process maps:
- Flowchart
- Comprehensive process map
- Document map
- High-level process map
- Rendered process map
- Value-added chain diagram
- Value-stream map
- Flow diagram
- Process flowchart
- Process model
- Workflow diagram
Typically, these visual diagrams are part of a company's business process management (BPM). This is the name given to a series of methods used to discover, model, analyze, measure, and optimize all the processes that comprise the running of a business.
Color organization
In database designing, color isn’t merely a stylistic choice. The colors you use in database design can significantly affect its user friendliness.
When desining a database of tasks you can use different colors to map the stage of each task, for example, yellow for 'in progress,' pink for 'pending,' green for 'done,' and red for 'stuck.'
The choice of colors in data visualization shouldn’t be arbitrary. Contrast can help you draw attention to the essential items. But overusing contrast or bold colors can have the opposite effect: cause confusion and fatigue in the viewer.
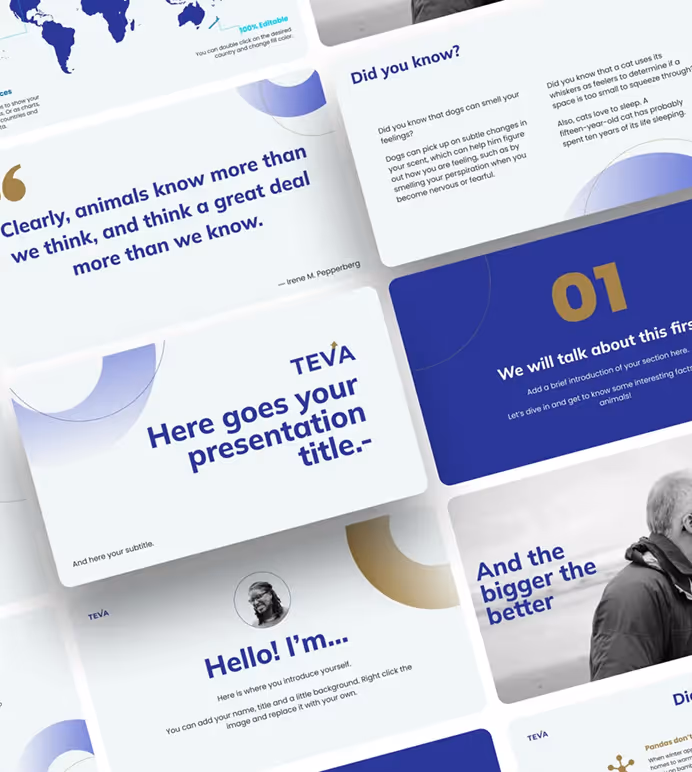
In this example of a presentation design created for one of ManyPixels’ clients, you can see how the designer employed color and contrast to add visual weight to different elements. One of the slides is a quote or a question that the viewer should consider before looking at the numbers. In another, the key takeaway is placed against the colorful background.

Usage of images and illustrations
What is database design without suitable images? Databases are typically dense with data, so seeing a lot of text and submenus on them might make people feel overwhelmed and bounce off the page.
Adding impressive visual design between large sections of text may assist page visitors in "taking a break" while also learning more about the subject matter they're reading.
There’s a common misconception that illustrations always appear unprofessional or even childish. In modern marketing and branding, nothing could be further from the truth. Illustrations come in various styles that can fit virtually any business or industry. Luckily, there are plenty of great online resources where you can find custom illustrations, such as the ManyPixels free illustration library!
Of course, it's also imperative to consider how illustrations interact with other design elements.
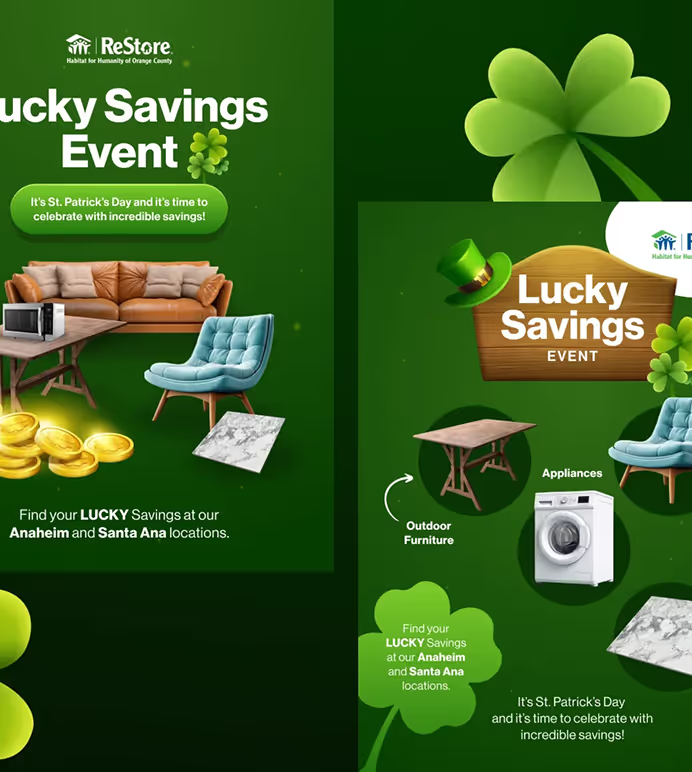
For example, this design informs people about proper legal actions in the case of a traffic accident. The illustrations help viewers identify with the situation better. Still, it doesn't seem overbearing or unpleasant to look at: who would want to look at photos of a car crash for an extended period?
Although it's commonly associated with optimism and communication, the yellow color works perfectly here since it's a color often found in traffic signs and notices, thanks to its visibility.

The importance of a practical layout
A non-designer will always think of colors, fonts, and images first. But a professional database designer knows that making sure all these elements work together is equally important.
This is where knowledge of design principles plays a critical role in any design, especially databases and data visualization. Understanding how to apply principles such as hierarchy, balance, and proximity ensures that the data isn't just shown but presented in a user-friendly manner.
Considering the correct layout is rarely only a matter of aesthetic appeal. .It’s one of database design basics that requires thought and testing. You need to consider the order of information (also called information architecture), how the most critical pieces of data are presented, and how viewers navigate the database to create an optimal database structure.
Whether it’s a simple Excel design or a highly customizable database in a tool like Miro, it’s always possible to ensure the layout serves your purpose.

Final thoughts
We hope these tips will help you transform boring databases into engaging, valuable assets for your organization.
There are plenty of nifty online tools you can use for things like creating flowcharts or process maps. But remember that no matter how appealing a template looks, the chances of it being perfectly suited to your needs are slim.
That's why it's always a good idea to hire a professional database designer who can help you translate your astute knowledge of data into graphics that anyone can understand.

Having lived and studied in London and Berlin, I'm back in native Serbia, working remotely and writing short stories and plays in my free time. With previous experience in the nonprofit sector, I'm currently writing about the universal language of good graphic design. I make mix CDs and my playlists are almost exclusively 1960s.

Top-quality designers
A complete creative team at your fingertips: graphic and web designers, illustrators, and more.

Lightning-fast turnaround
Get start today and receive your first update on the next business day.

All-inclusive pricing
Unlimited requests and revisions. One flat monthly fee. No surprises.

Flexible & scalable model
No contract. Scale up and down as needed. Pause or cancel at anytime.

Continue reading

.jpeg)
.jpeg)
Explore some of our best designs
Get inspired by a curated selection of ManyPixels work. Download the portfolio to see what our team can create.