Useful and Creative Infographic Ideas to Inspire Your Design
Infographics are a phenomenal way of conveying information and succinctly presenting data. Here are some of our favorite infographic ideas you should try out!

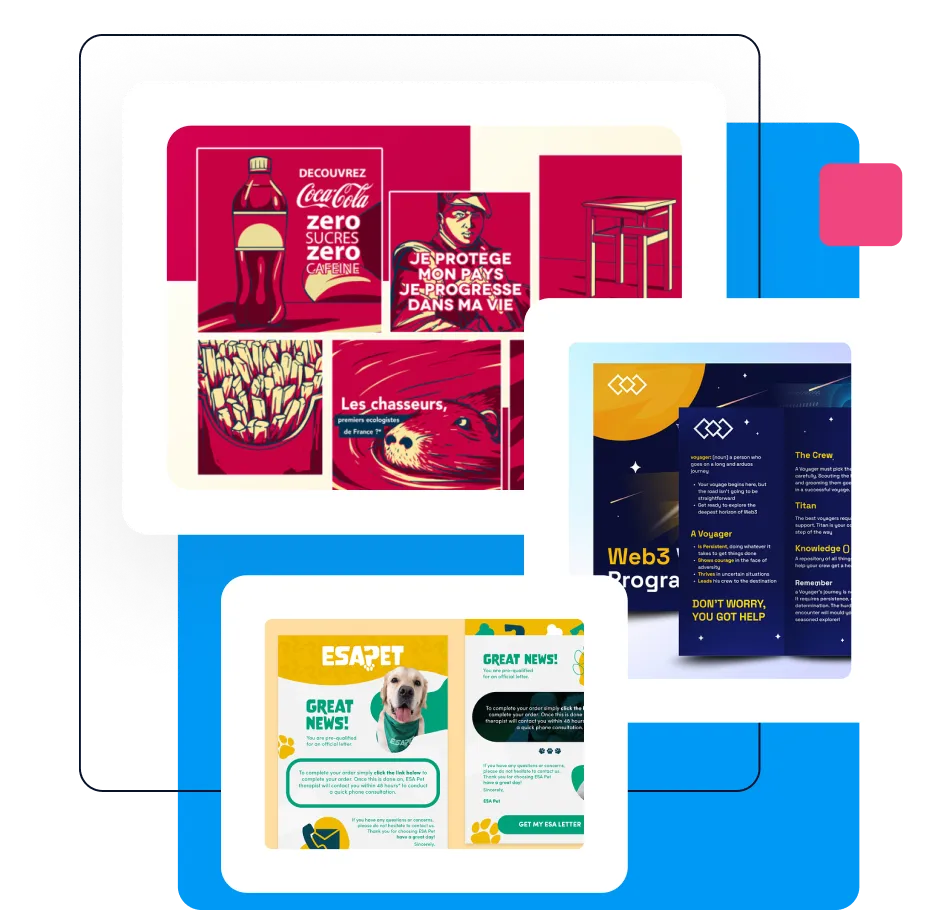
.svg)


Infographics are a staple of the modern digital world. Since 2010, Google search volume for “infographic” and “infographics” has increased by a whopping 800). It’s easy to see why. Humans are incredibly visually-oriented, and information presented visually will be more digestible and likely to be remembered. Fun infographic ideas can be easily found. Let’s take a look at some of our favorites!
First off, though, infographics and data visualizations are not the same thing. In simplest terms, data visualizations are tools that show statistics, such as pie charts and graphs. Infographics are a much broader collection of imagery that includes data visualizations and illustrations.
{{INFOGRAPHICS_PORTFOLIO="/dev/components"}}
How to get ideas for infographics?
Infographics can be made for almost any topic, and websites that use them to convey a great amount of information in a limited amount of space. They are a staple for curated and well-thought out web design and can be used for almost any kind of website.
Here are a few ways to find ideas for infographics that are relevant and useful to your intended audience.
- Pick a single, important issue to your brand. For example, a sustainable clothing brand should focus on statistics like water consumption and responsible farming practices.
- Look at your own data. Find out who uses your product/service and why. This is also useful in reaching new potential customers.
- Instruct your customers on how to use your product/service. How-to infographics are a great way to boost engagement and help people connect with your brand.
- Give an overview of your performance or impact, such as an end of year review. This will help you identify the strengths and weaknesses of your product/service. It will also give potential customers a better insight into your company.
What is the main idea of an infographic depends on the service or product you’re offering. Make sure you find relevant information to include in your infographic. The best way to ensure this is to do thorough research about your product or service and the competition.
Creating infographics can be difficult. With so much information, it can be overwhelming trying to decide which pieces to include. However, a good rule of thumb is to focus on statistics.
One of the best ways to get inspiration for your infographics is perusing the already existing material. You should pay heed to current industry trends and latest news.
Below you’ll see some of the best infographic design ideas which you can include in all kinds of projects!
Workflow infographics
The first infographic shows steps in a workflow for creating a product launch marketing campaign. It’s a neat template that leaves plenty of space for information.
It can also be a great option for outlining procedures for completing certain projects or jobs. It’s a versatile design and can be a valuable addition to things like brochures or pamphlets.

The infographic above is a beautiful example of quality infographic that uses creative and detailed design. It shows that infographics can be educational and beautiful, which helps readers retain information.
The following infographic can be used as a learning aid, seeing as it gives detailed information on the differences between arteries and veins, but it can also be used for informing and educating the wider public. It can help the reader have that distinction in mind during health crises.
Comparison infographics are also useful in education. The infographic below, for example, offers brief and concise explanations about the differences between fiction and non-fiction works. As such, it can be a valuable aid in literature or film lessons.
It’s clear and concise, suggesting realistic actions any person can take. All of these can be done in tandem with a particular charity institution, such as food banks or animal shelters.
Infographics on how to get involved in charity work are also incredibly important for nonprofits. The infographic below shows ways to support and bolster charity work in your community without donating money.
Below is an example of an infographic that shows two key demographics, with their age, gender, likes, dislikes, ambitions or challenges. All this information is crucial for optimizing your marketing strategy and attracting your ideal customer.
A workflow infographic is also great for outlining and tracking goals. This kind of infographic is most often used by startups and small companies. Timeline structures provide a clear frame in which certain goals need to be achieved.


Workflow is a popular type of infographic, as they can describe and explain complex processes by breaking them down into smaller increments and going through the process step-by-step.
It’s a great training tool for companies, as well as schools or universities. Workflows document the process of creating a project or experiment.
Buyer persona infographics
Customer personas are an incredibly important part of any marketing strategy. They help you optimize your brand for your intended audience, so an infographic detailing all the aspects of a customer persona can be a useful tool for a marketing department.
These infographics provide the reader with all the vital data about the ideal customer persona the brand wants to attract.


Stock photos are useful tools for design, but in infographics it’s better to stick to illustrations in most cases. Illustrations can be customized and made from scratch to fit the vision of the infographic.

Data-driven infographics
Infographic ideas often center around a specific topic. This allows them to give detailed data, such as statistics and metrics and put them in context.
The example below is a great representation of this. It’s jam-packed with information, yet it doesn’t look overwhelming, thanks to clever designing. It presents the data collected in a survey regarding file loss and backup. However, rather than being overly clinical and minimalistic, it keeps the readers’ attention with illustrations and visual representations of data.

Showing data progression is also a great source for infographic design inspiration. Data progression is massively useful in sales, as well as social studies, as it helps you pick up on slow trends, i.e. small changes that happen over a long period of time. These small changes often compound to great strides, and they can be tracked through a data progression infographic.
The next infographic shows the trends in real estate sales in a 10-year period. It includes data about the years in which there were most and least real estate sales, as well as the top and bottom counties in sales.

But, you don’t have to show the data progression over a long period of time. The infographic below is a good example. This kind of infographic can be an awesome tool for companies that want to identify their shortcomings and increase their performance.

Nonprofit infographic ideas
Infographic ideas for nonprofits can include all kinds of data, from statistics, to how-to’s and steps for organizing food drives, charity runs or other events.
They can be a powerful tool for informing the public on a nonprofit’s work and goals. Ideas for infographics in the nonprofit sector are numerous, whether it's education, housing, poverty or raising awareness about illnesses or environmental issues.

Fundraising is an important part of nonprofit and charity work. Informing the people on the money needed to achieve goals is vital in keeping the campaigns going, and for ensuring the transparency of the organization behind the fundraiser. It’s important to show potential donors where their money is going, and what it’s being used for.


Detailed instructions on how to participate in donations are also one of the most common infographic ideas. They are often included in websites, as well as pamphlets during a particular charity drive.


Comparison infographics
Comparisons are great ideas for infographics, as they help the reader visualize all the information for different concepts, brands, products or services.

How to get ideas for infographics largely depends on what you need an infographic for. In the case of comparative infographics, your first step would be researching the competition. Find out how your product or service differs from others and play to your strengths.
However, comparison infographics aren’t only a marketing tool.They are also quite handy in presenting data from conducted surveys and studies. Comparison infographics can be used in almost any field, which makes them incredibly versatile and popular.


Project infographics
This kind of infographic introduces a future project, whether it’s real estate development, a school program or any kind of business project. This is a broad topic that can inspire creative infographic design.

With a project infographic, it’s important to include the factual data, as well as share the vision behind the project. The latter is especially important, because that is what most people will take away from the infographic.
You should always draw infographic design ideas from your project. That way it will be easier to create them in a similar tone. This cohesion is especially important for building brand recognition. Find some examples of what you want your infographic to accomplish and draw from that.

Project infographics can be used both in web presentations of the project, classic Powerpoint presentations, as well as printed material. Through them, you’ll be able to reach the most people. Infographics should also be included in the information packages and booklets for potential investors. Naturally, the information in booklets is much more detailed, but infographics are great for giving an overview of the most important points.
Conclusion
Fun infographics can be very helpful for promoting your brand and raising the customers’ awareness. “What is the main idea of the infographic” is the first question you should ask yourself before you create one. An infographic is a supplementary tool, which means it should follow the general idea of your marketing strategy or project proposal.
Creating infographics, although difficult, is rewarding because you get to present and delve deeper into your accomplishments. On the other hand, if it’s an infographic for a future project, it can be the beacon that guides you through the process of creation. We hope these examples will inspire and help you create your own awesome infographics, or give actionable feedback to your infographic design service of choice.

I hold two degrees in history, and am currently working on a project of creating a digital library of Medieval manuscripts. I still like to have a foot in the 21st century though, so I write freelance about my other big passion, art and design. All Lord of the Rings references and puns I make are intentional.
A design solution you will love
Fast & Reliable
Fixed Monthly Rate
Flexible & Scalable
Pro Designers


.avif)