7 Best infographic makers for non-designers (ranked and reviewed)

TABLE OF CONTENTS

TL;DR:
The best infographic maker for non-designers depends on what "easy" means to you.
✅ Canva is the safest pick for most people: huge template library, zero learning curve, free plan included.
✅ Piktochart wins if you want AI to build the infographic from a text prompt.
✅ Venngage is the strongest option for marketers working with data.
✅ Snappa is the fastest to learn. Adobe Express covers you if you're already in the Adobe ecosystem.
✅ Visme handles animated and interactive formats better than any tool on this list.
✅ ManyPixels lets avoid the DIY approach and sends you a finished infographic designed by a real person, usually within 24 to 48 hours.
Why most infographic tools fail non-designers
The problem isn't a shortage of tools. There are dozens of infographic makers out there, most of them with free plans and thousands of templates. The problem is that most of them hand you a blank canvas, point you at a library, and leave you to figure out the rest.
That's fine if you have a design eye. If you don't, you end up with something that looks like clip art from 2009.
The best infographic makers for non-designers reduce the gap between having an idea and having a finished file that looks professional. Some do this with AI. Some do it with tightly constrained templates. Some do it by removing the canvas entirely and just assigning you a designer. Each approach works for a different kind of person.
We looked at what tools actually appear in search results, tested the category, and ranked seven options below based on how well they hold up for someone with no design background.
Pricing is approximate. Check each tool's website for current rates.
1. Canva: best all-around for non-designers
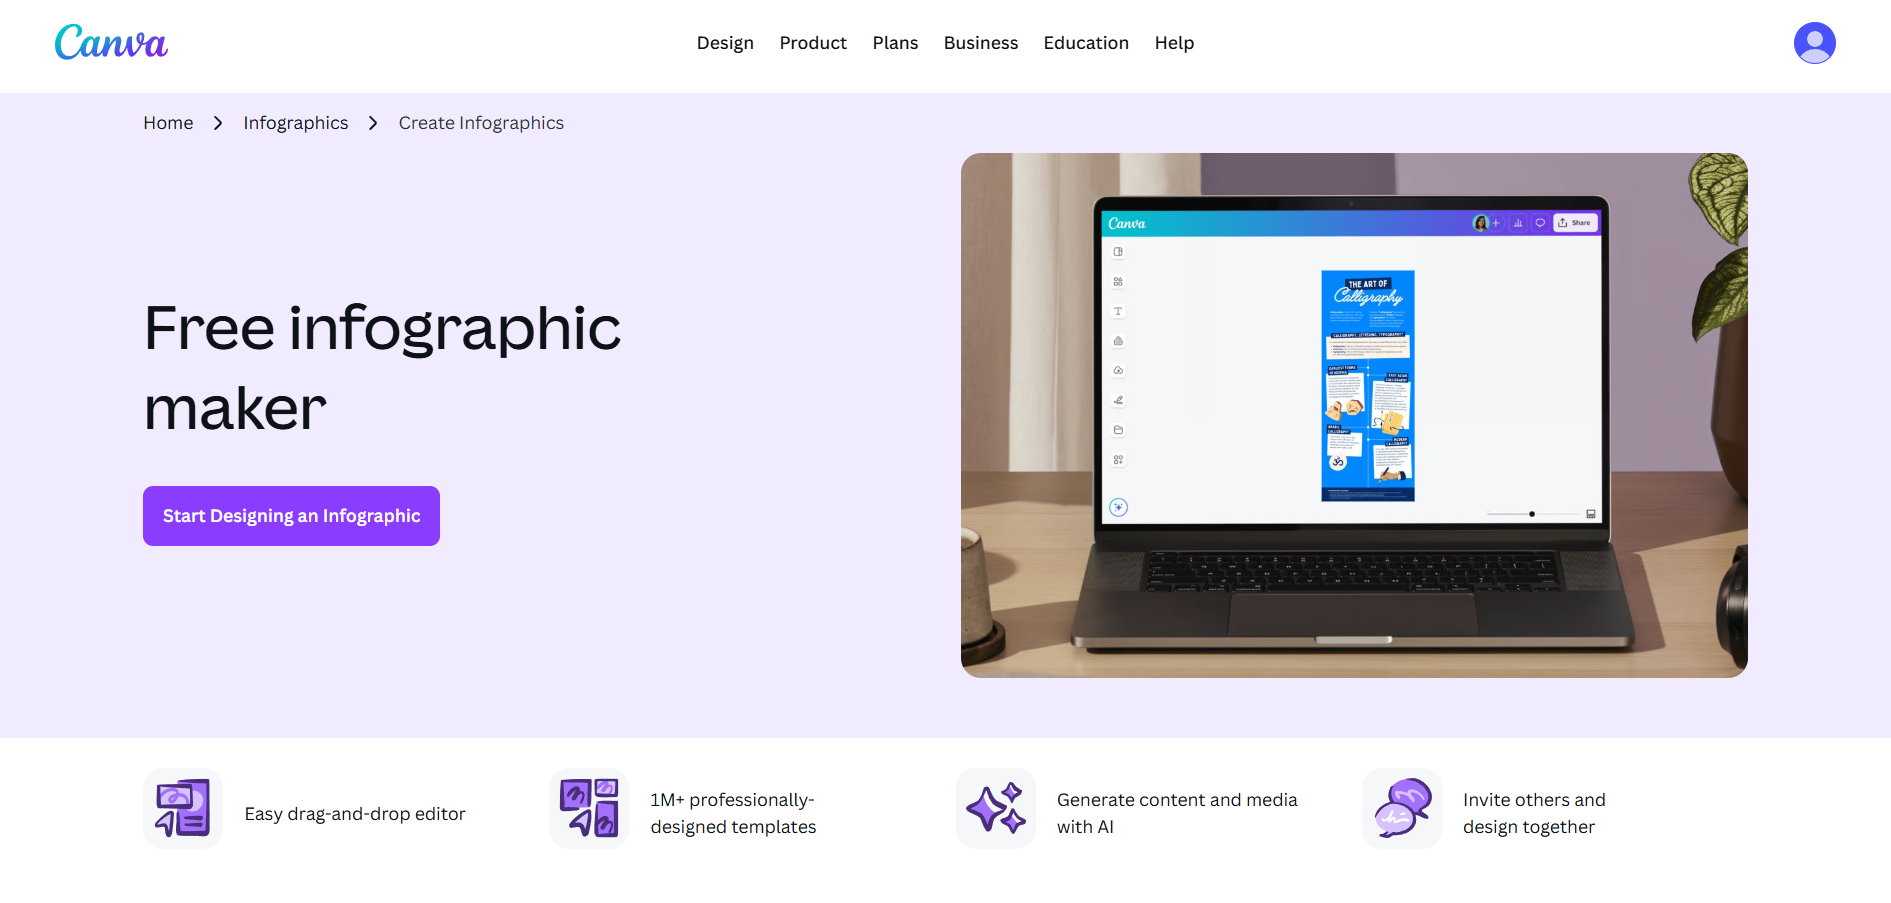
Canva is the most widely used visual design tool in the world, and it holds that position for a reason. The free plan includes thousands of infographic templates, a drag-and-drop editor that requires no training, and enough stock photos and icons to cover most projects without paying a cent. For a non-designer who needs to create an infographic and has never opened a design tool before, Canva is the lowest-friction starting point available.
The templates are genuinely good. Canva has invested heavily in professional layout design, which means the default output looks polished even if you only swap the text and colors. The Magic Design feature lets you generate a starting layout from a prompt, which helps when you're not sure where to begin.
The honest limitation is customization depth. Canva is excellent for standard formats (social media, presentations, basic infographics) but starts to feel restricted for complex data visualizations or anything highly bespoke. The free plan also doesn't allow transparent background downloads, which matters for some use cases.
✅ Best for: Non-designers who need a reliable all-purpose tool with a strong free plan
❌ Not ideal for: Data-heavy infographics or heavily customized layouts
2. Piktochart: best AI-powered infographic maker
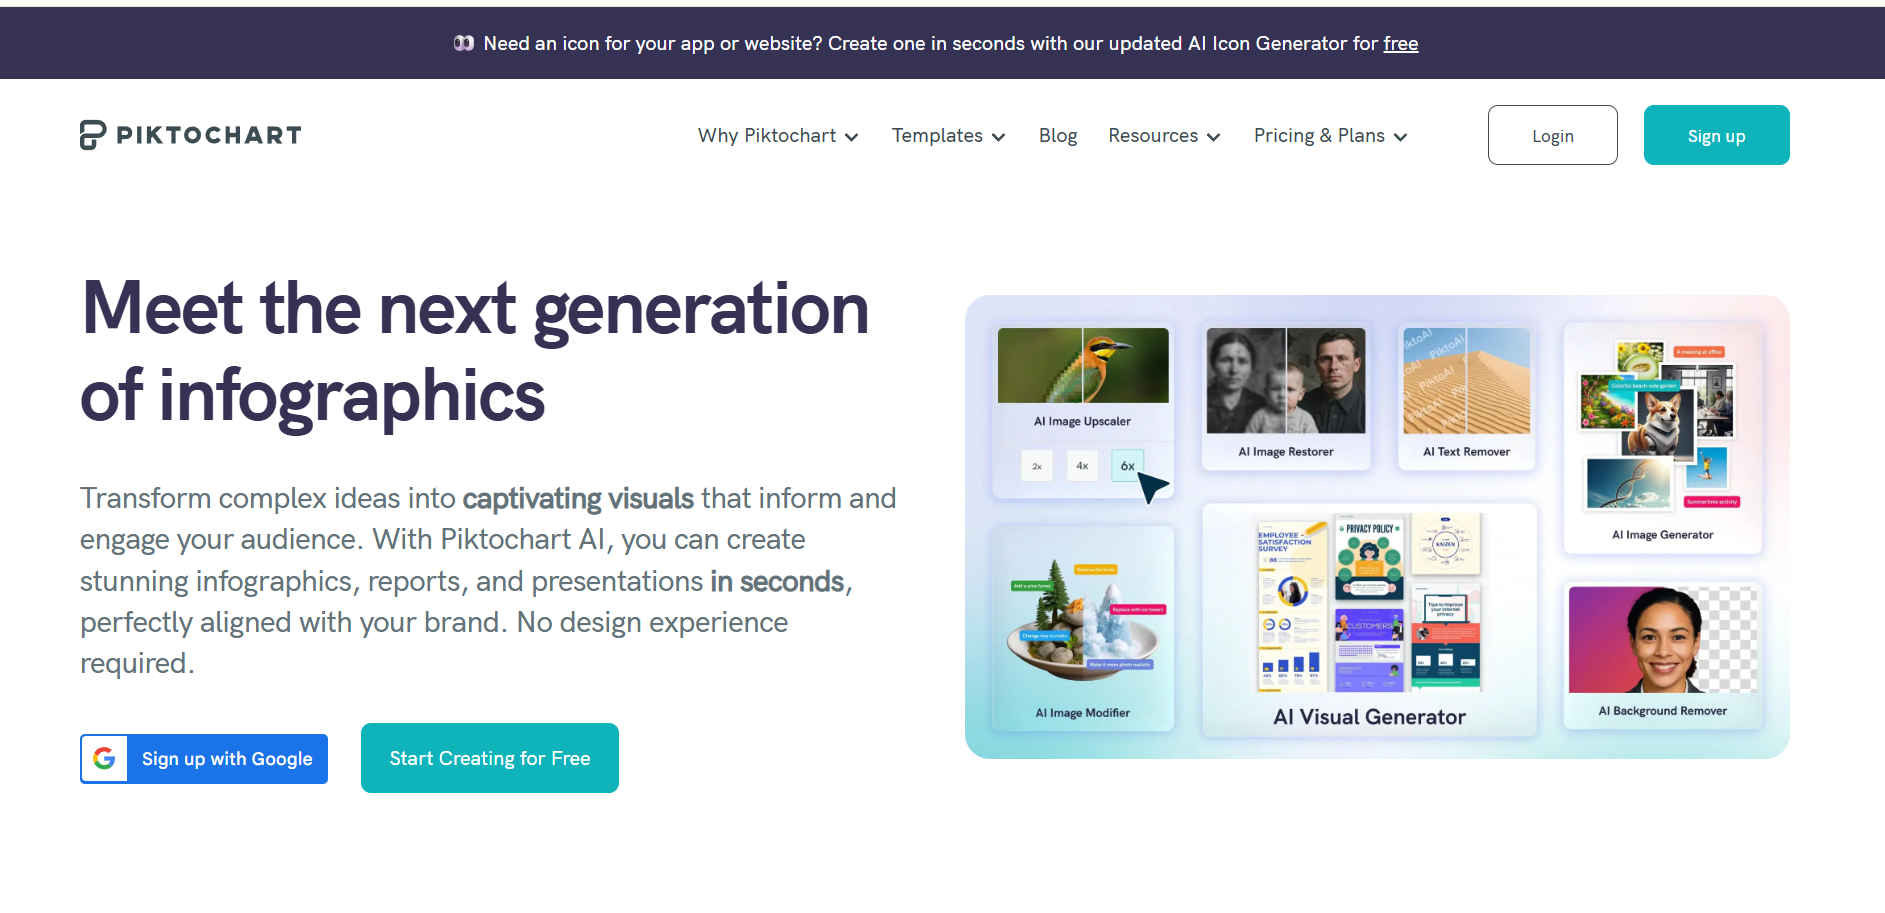
If you want to type a topic and get a finished infographic back, Piktochart is the strongest option in this category right now. Its Pikto AI feature takes a text prompt, a document, or an uploaded PDF and generates a complete infographic with charts, icons, and layout applied. The output lands in the same editor, so you can tweak anything without starting over.
What separates Piktochart from other AI tools is data handling. You can paste in a spreadsheet, and the AI selects the appropriate chart type for your numbers. Brand kits sync across every draft, which matters for teams producing multiple infographics under one visual identity. The template library runs to 800+, most of them designed for business communication rather than generic use.
The free plan is usable but limited in exports. The Pro plan unlocks the full AI workflow and removes branding from downloads. Worth noting: Piktochart is particularly strong for long-form content like reports and presentations, not just standalone infographics.
✅ Best for: Non-designers who want AI to do the heavy lifting from a text input or document
❌ Not ideal for: Quick one-off social media graphics where Canva's interface is faster
3. Venngage: best for marketers and data-heavy content
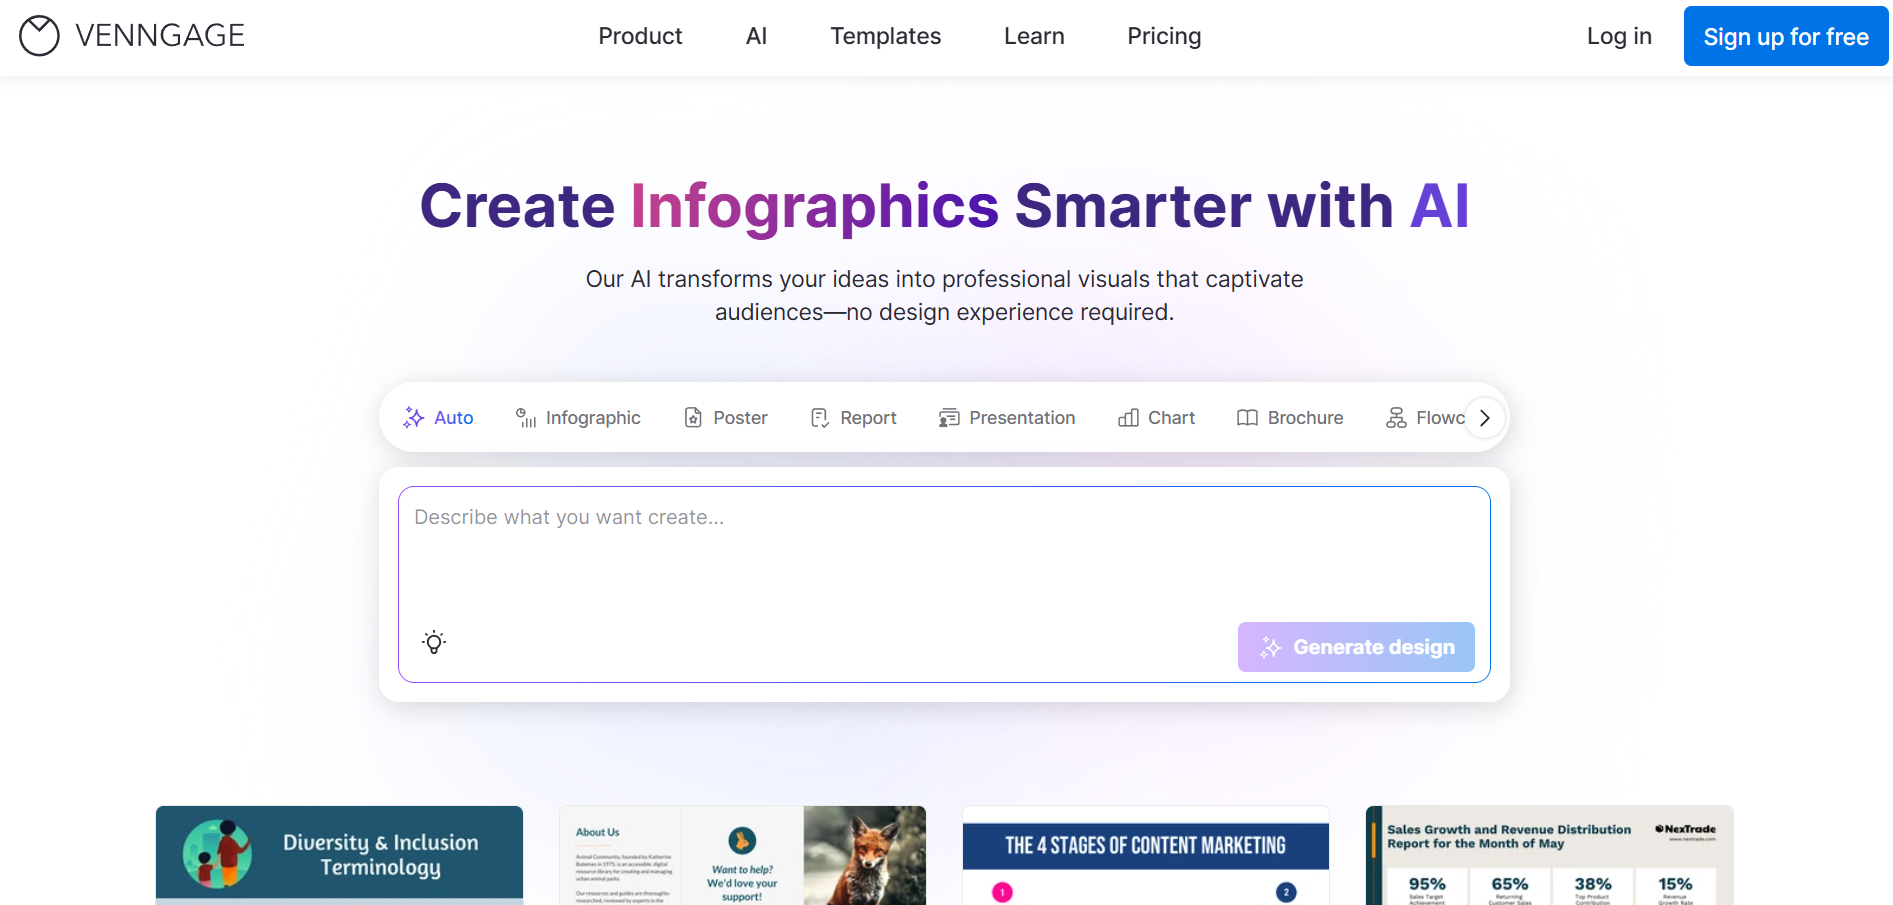
Venngage sits at position 3 in Google's search results for "best infographic maker" with good reason. The template library runs to 10,000+, and the platform leans heavily toward marketing-ready layouts: statistical infographics, process diagrams, comparison charts, and report-style formats that look like they came from a design team.
The AI tools are accessibility-focused, meaning they help you check color contrast and readability automatically. For marketers creating content that needs to hold up in presentations or external reports, that matters. The editor is clean and the data widgets are practical for teams that need to visualize numbers without building charts from scratch.
The catch is the free plan. Free members can build infographics but cannot download them. That's a meaningful restriction. The paid plans start at roughly $19/month and are where the tool's real value shows up. Also worth noting: the search within the template library is not great, which makes finding the right starting point slower than it should be.
✅ Best for: Marketers who need polished, data-forward infographics for external communication
❌ Not ideal for: Anyone on a strict free plan
4. Adobe Express: best for quick creation inside the Adobe ecosystem
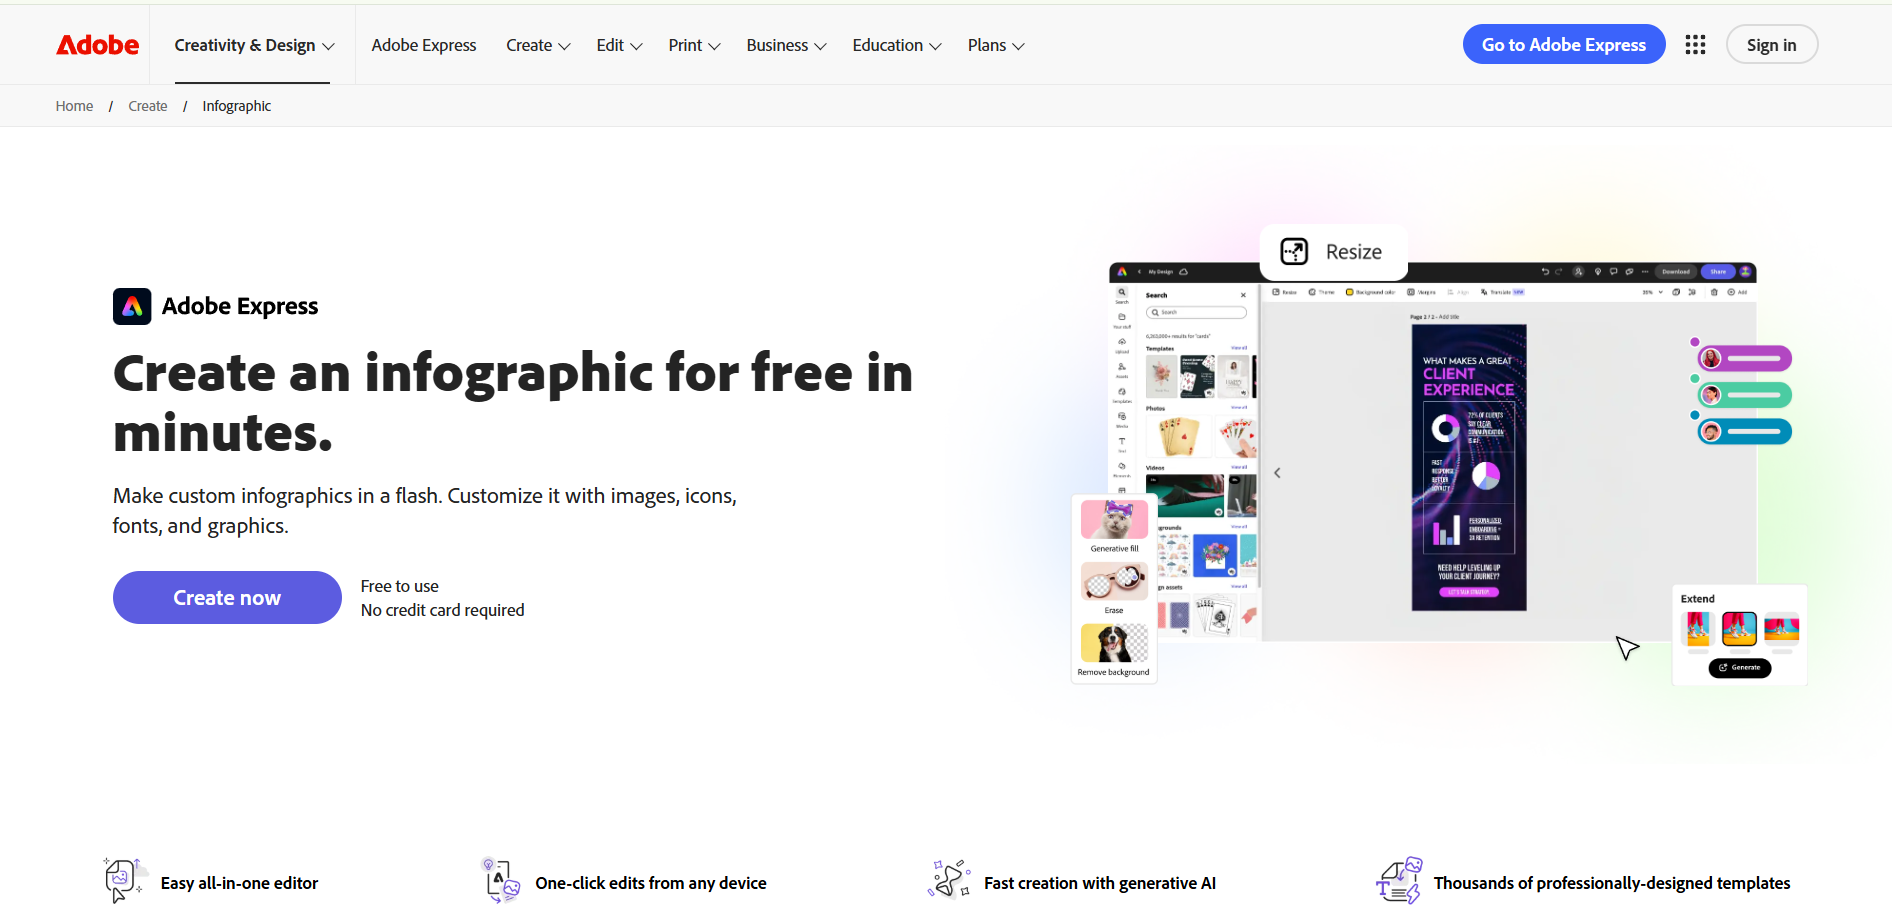
Adobe Express ranks second in Google for "best infographic maker" (behind only Canva's own tool page), which reflects its domain authority more than its niche strength. That said, it's a genuinely solid tool for non-designers who are already inside Adobe's world. The free plan is usable, the templates are professional, and the cross-device sync means you can start a design on desktop and finish it on mobile.
The main advantage is integration. If you're working in Creative Cloud, Express connects to your Adobe assets, fonts, and brand kits without any import steps. The text-to-template AI feature generates quick starting layouts that are good enough for most social media and presentation needs.
Where Express falls short is depth. Chart and data visualization options are more limited than Piktochart or Venngage. It's best framed as a tool for quick, clean infographics rather than complex data-driven ones. For someone not already in the Adobe ecosystem, there's no compelling reason to choose it over Canva.
✅ Best for: Teams already using Adobe Creative Cloud who want a consistent workflow
❌ Not ideal for: Data-heavy infographics or users outside the Adobe ecosystem
5. Visme: best for animated and interactive infographics
If you need your infographic to move, Visme is the tool on this list that handles it best. It supports animations, transitions, clickable elements, and embedded media in a way the other tools don't come close to matching. For marketers publishing infographics directly to web pages rather than exporting flat image files, that's a meaningful differentiator.
Beyond animation, Visme is a full visual content platform: infographics, presentations, reports, whitepapers, and social media graphics all live in one editor. The AI tools are solid and accept text prompts, data imports, and document uploads. The template library runs to 1,000+, with strong coverage of data-heavy formats.
The customization is less intuitive than Canva. You can build almost anything in Visme, but you'll need to explore the settings more than on simpler tools. The free plan is limited in storage and exports. For teams that only need static infographics, it's more tool than they need. For teams that want to embed interactive visuals, it's the right pick.
✅ Best for: Marketers who need animated or interactive infographics for web publishing
❌ Not ideal for: Users who just want a quick static image and find the interface overkill
6. Snappa: best for non-designers who want zero learning curve
Snappa doesn't have the AI features or the template depth of the other tools on this list. What it has is simplicity. The interface is minimal by design: you pick a template, swap your content, and download. There's no learning curve to speak of, which is exactly what some non-designers need.
The library includes 48 infographic templates and access to over 5 million stock images and 200+ fonts. The templates skew toward clean, social media-ready layouts rather than complex data visualizations. The free plan limits you to three downloads per month, which is restrictive but covers occasional use.
Be real: if you need data visualization or AI generation, Snappa isn't the tool. It's for someone who wants to move fast, doesn't want to learn a new platform, and is creating straightforward infographics on a recurring basis. Paid plans run roughly $15/month and unlock unlimited downloads and saved designs.
✅ Best for: Non-designers who want the fastest path from template to download with minimal complexity
❌ Not ideal for: Complex infographics, data-heavy formats, or AI-assisted creation
7. ManyPixels: best if you'd rather skip the DIY entirely
{{INFOGRAPHICS_PORTFOLIO="/dev/components"}}
ManyPixels is the only infographic design service on the list, meaning you don’t actually have to take the DIY route. You submit a request describing what you need, and a vetted designer delivers a first draft within 24 to 48 hours. Revisions are unlimited, you own 100% of the output, and infographics are covered across all plans alongside social media graphics, web design, presentations, and more.
The honest framing for non-designers: every other tool on this list requires you to produce the output yourself. That's fine for simple graphics, but infographics often involve complex data, custom illustrations, and layout decisions that are genuinely hard to get right without design experience. ManyPixels removes that problem entirely.
The difference between plans comes down to output volume and whether you want a dedicated designer. The Advanced plan ($699/mo, approximate) delivers one daily output with next-day turnaround. The Assigned Designer plan ($1,399/mo, approximate) gives you a specific designer you pick from a portfolio, with real-time Slack communication and same-day delivery.
ManyPixels has delivered 150,000+ projects since 2018, holds a 4.8/5 rating on Trustpilot (137 reviews) and 4.9/5 on G2 (25 reviews). You can also pause your subscription for $10/month if you don't need active design work.
✅ Best for: Teams or individuals who want professional infographics without doing the design work themselves
❌ Not ideal for: One-off projects or anyone not needing ongoing design output
Which one should you use?
If you need something today and have no design experience, start with Canva. The free plan is genuinely useful and the templates are polished enough to produce professional output without any customization skill.
If you have data or a document you want turned into an infographic automatically, use Piktochart. The AI workflow is the most practical on this list for that specific use case.
If you're a marketer producing infographics for external reports or campaigns, Venngage has the template depth and data widget coverage that fits that workflow best.
If you need the infographic to be animated or interactive for web publishing, Visme is the only tool here that handles it well.
If you want the simplest possible tool with no features to learn, Snappa. Pick a template, swap your content, download.
If you're already in Adobe Creative Cloud and want to stay there, Adobe Express is the low-friction option.
If you produce infographics regularly and want a professional result without doing the design work, ManyPixels is worth a look. The per-month cost makes no sense for a single infographic, but for teams with ongoing design needs across multiple formats, it's a different calculation.
Frequently asked questions
Bottom line
For most non-designers, Canva is the right starting point: it's free, the templates are good, and there's nothing to learn. If you have data to visualize or want AI to do the work, Piktochart is the better pick. And if producing professional infographics is a regular part of your content output and the DIY tool approach keeps producing mediocre results, ManyPixels is the option worth pricing out.
{{GRAPHIC_BANNER="/dev/components"}}
The best infographic maker isn't the one with the most features. It's the one you'll actually use to finish something.
👉 Explore ManyPixels plans to see if a design subscription fits what you're building.

Having lived and studied in London and Berlin, I'm back in native Serbia, working remotely and writing short stories and plays in my free time. With previous experience in the nonprofit sector, I'm currently writing about the universal language of good graphic design. I make mix CDs and my playlists are almost exclusively 1960s.

Top-quality designers
A complete creative team at your fingertips: graphic and web designers, illustrators, and more.

Lightning-fast turnaround
Get start today and receive your first update on the next business day.

All-inclusive pricing
Unlimited requests and revisions. One flat monthly fee. No surprises.

Flexible & scalable model
No contract. Scale up and down as needed. Pause or cancel at anytime.
Continue reading


Explore some of our best designs
Get inspired by a curated selection of ManyPixels work. Download the portfolio to see what our team can create.